
My website was enjoying perfect Lighthouse scores on every page, right up until I decided to redesign the reads page. That page is just a collection of lines I liked from different sources. Or at least, the ones I remembered to add.
The old page was just a simple list of quotes you could shuffle. Honestly, I can’t remember why I thought a shuffle button was necessary. But it had been like that for at least a couple of years, maybe more. This weekend, while waiting for my Claude plugin to get approved, I wanted to try something new..

I sketched a rough draft of what I wanted, brought it to life with Claude Design, made a few tweaks, and then redid the whole design with a single prompt in Claude Code. It took about 30 minutes in my terminal.. right before I went to sleep.
It was pretty simple. The quotes float as 3D cards over a photo, and you can move through them with the wheel, a swipe, arrow keys, or a click, depending on your device. The page uses three.js, and each card face is painted to a canvas with the quote, its attribution, and a theme, then used as a texture. The quotes also stay on the page as visually hidden text so screen readers can still access them because accessibility matters. How could I forget that?
bonusA canvas is just a picture of text, so a screen reader can’t read it. That’s why the quotes are also on the page as plain, visually hidden text, and why the arrow keys work too. If you want the long version of that thinking, my web accessibility guide covers semantic HTML, keyboard support, and focus. And if you want accessibility regressions caught before they ship, I have also written about automated accessibility testing with axe-core and Playwright.
Ok, so Claude finished implementing the design, ran it through Playwright, and checked it. And it looked pretty good for a single-shot implementation and was close to what I wanted. Maybe it turned out well because of the process: sketching what I wanted, running it through Claude Design, and then letting Claude implement it on my website as is. After that, I just commit, push and let CI handle the rest. Well.. committing, pushing, creating a PR, and watching CI was also Claude’s job in that session.
Then I do what I always do after a change. I open PageSpeed Insights. It’s just pure habit at this point. The github actions in repo already do lighthouse and a11y checks so I get plenty of automated warnings if there are any. I still like dropping the URL in and watching the gauges fill. It’s like checking the oven again even when the timer is on?
Performance score landed on 64.
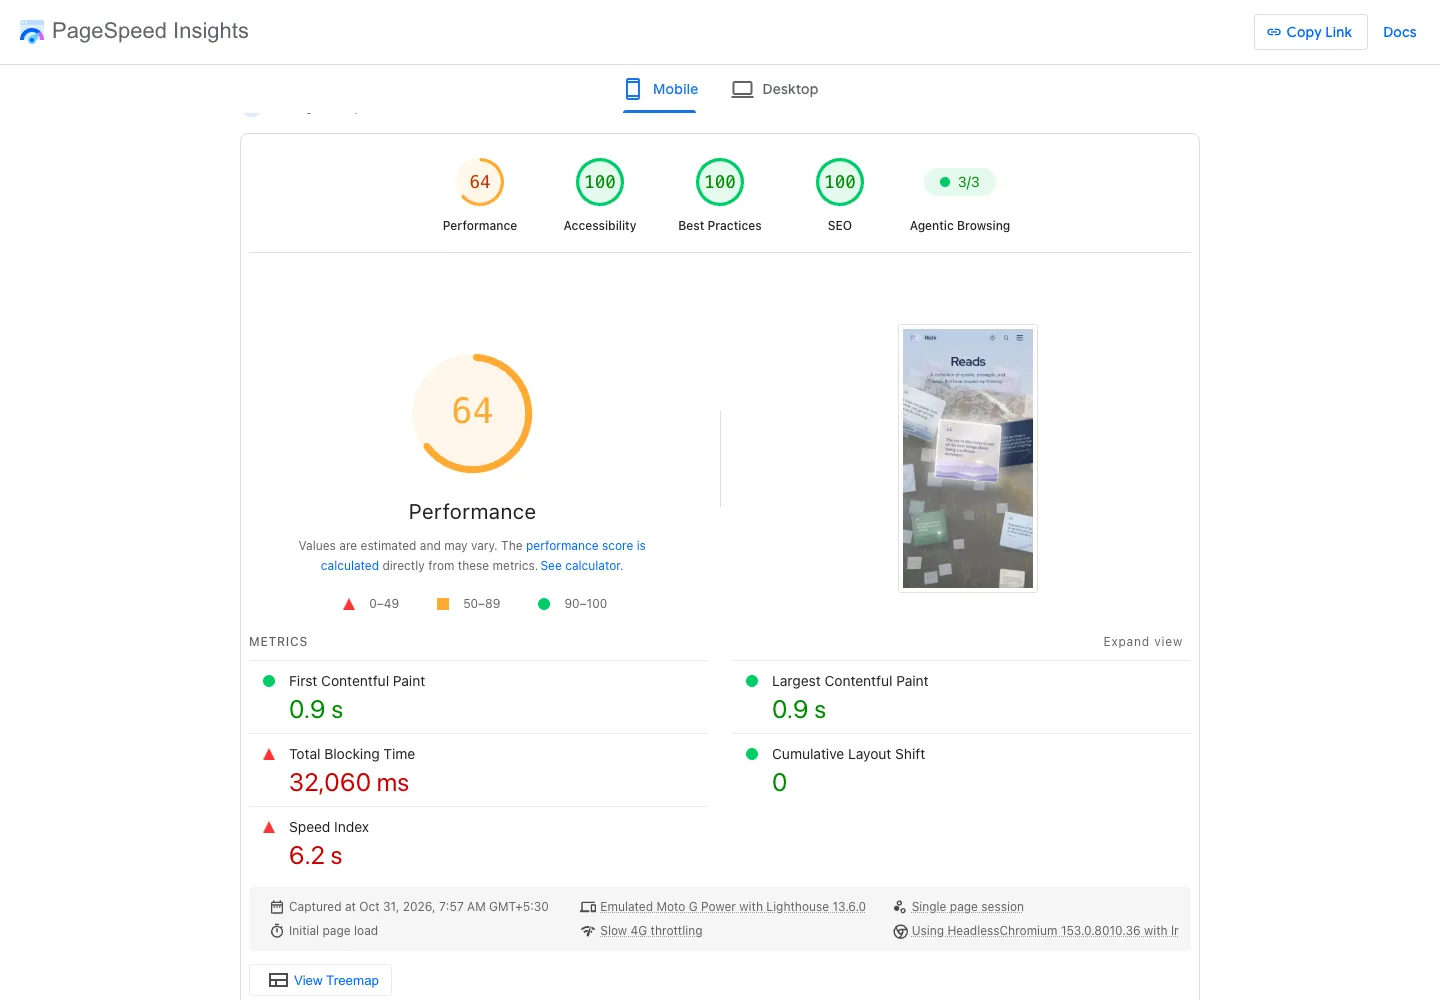 The mobile report(opens in new tab) straight after the redesign. Green paint metrics, red everything else.
I was a little surprised, but not too much. I had just added a WebGL scene to a page that used to be a simple list of quotes, so I kind of expected some performance cost. Most devices can handle some three.js, but the evaluation happens on a low-end CPU with network throttling.
What I didn’t expect was how the results looked. First Contentful Paint: 0.9s. Largest Contentful Paint: 0.9s. Cumulative Layout Shift: 0. All green.
But then, in red just below: Total Blocking Time, 32,060ms.
That’s thirty-two seconds on a page that used to score 100 on mobile before I redesigned it.
Why one red number sank the score
Total Blocking Time (TBT) is the one that bit. web.dev defines it(opens in new tab) like this: any task on the main thread that runs longer than 50ms is a long task, the blocking time of that task is whatever it ran beyond 50ms, and the page’s TBT is the sum of those after First Contentful Paint.
web.dev’s own example shows this clearly. Three 51ms tasks add up to 3ms of TBT. A single 10-second task adds up to 9,950ms. The metric penalizes one big block much more than many small ones, and my page was one big block.
The report even shows the arithmetic. It lists what each metric contributed to the score: FCP +10, LCP +25, TBT +0, CLS +25 and Speed Index +4. That’s 64. In the 100 report later, the same list reads +10, +25, +30, +25 and +10. So TBT alone was worth 30 points and I’d spent all of them, plus six more on Speed Index.
So LCP was fine. The page painted its first frame quickly, then just froze while loading. A page can look ‘done’ but still not respond to a tap. That’s exactly what this metric is meant to catch.
The diagnostics agreed: 42.0s of main-thread work, 3.1s of JavaScript execution, 20 long tasks.
Reproducing a machine I can’t see
I can’t access the machine that PageSpeed Insights uses for testing. The report mentions Moto G Power emulation, Lighthouse 13.6.0, slow 4G, and headless Chromium. On my laptop, Lighthouse gave the page a score I’d be happy with. That says something about my laptop.
That it has a GPU.

I guessed that the test machine renders WebGL in software, though I can’t confirm that for PageSpeed’s machines. So I built a harness that acts the same way: headless Chrome forced to use software GL, a 4x CPU throttle, slow 4G, and a dozen busy processes to use up spare CPU. This setup reproduced the problem.
PS: These are my local numbers and mostly based on my desperation to get to bed after a long day, so they’re just proportions and numbers I took off the screen from the report.
With that harness, the old page spent about 7,100ms on long tasks. Three things stood out. All on the main thread and all before anyone could interact with the page:
- About 2.4s creating the WebGL context, inside
renderer.setSize. - About 1.4s compiling shaders.
- About 0.5s preparing the photo background.
A few things I tried at first didn’t help. Turning off antialiasing made no difference. I also hoped to detect a slow renderer and skip the scene, but failIfMajorPerformanceCaveat didn’t flag the software renderer in Chrome. So there was nothing to detect.
Fix one: move three.js into a worker
If the main thread can’t afford it then don’t run it there. OffscreenCanvas lets a canvas be rendered inside a worker, and MDN says it’s widely supported(opens in new tab) across browsers since March 2023. The page will have the <canvas> element, pass control of it to the worker, and the worker will handle the rendering:
var offscreen = canvas.transferControlToOffscreen();var worker = new Worker(new URL('./worker.js', import.meta.url), { type: 'module' });worker.postMessage({ type: 'init', canvas: offscreen }, [offscreen]);After that, the page only does what it needs to: read the wheel, pointer, keyboard, and theme. Then it sends messages to the worker. Context creation, shader compiles, and every frame now happen elsewhere. If a browser doesn’t support transferControlToOffscreen, it still runs the renderer on the main thread, so the page continues to work.
I also added a CSS-only loading screen with three cards fanning out, so the first few seconds aren’t just an empty photo.
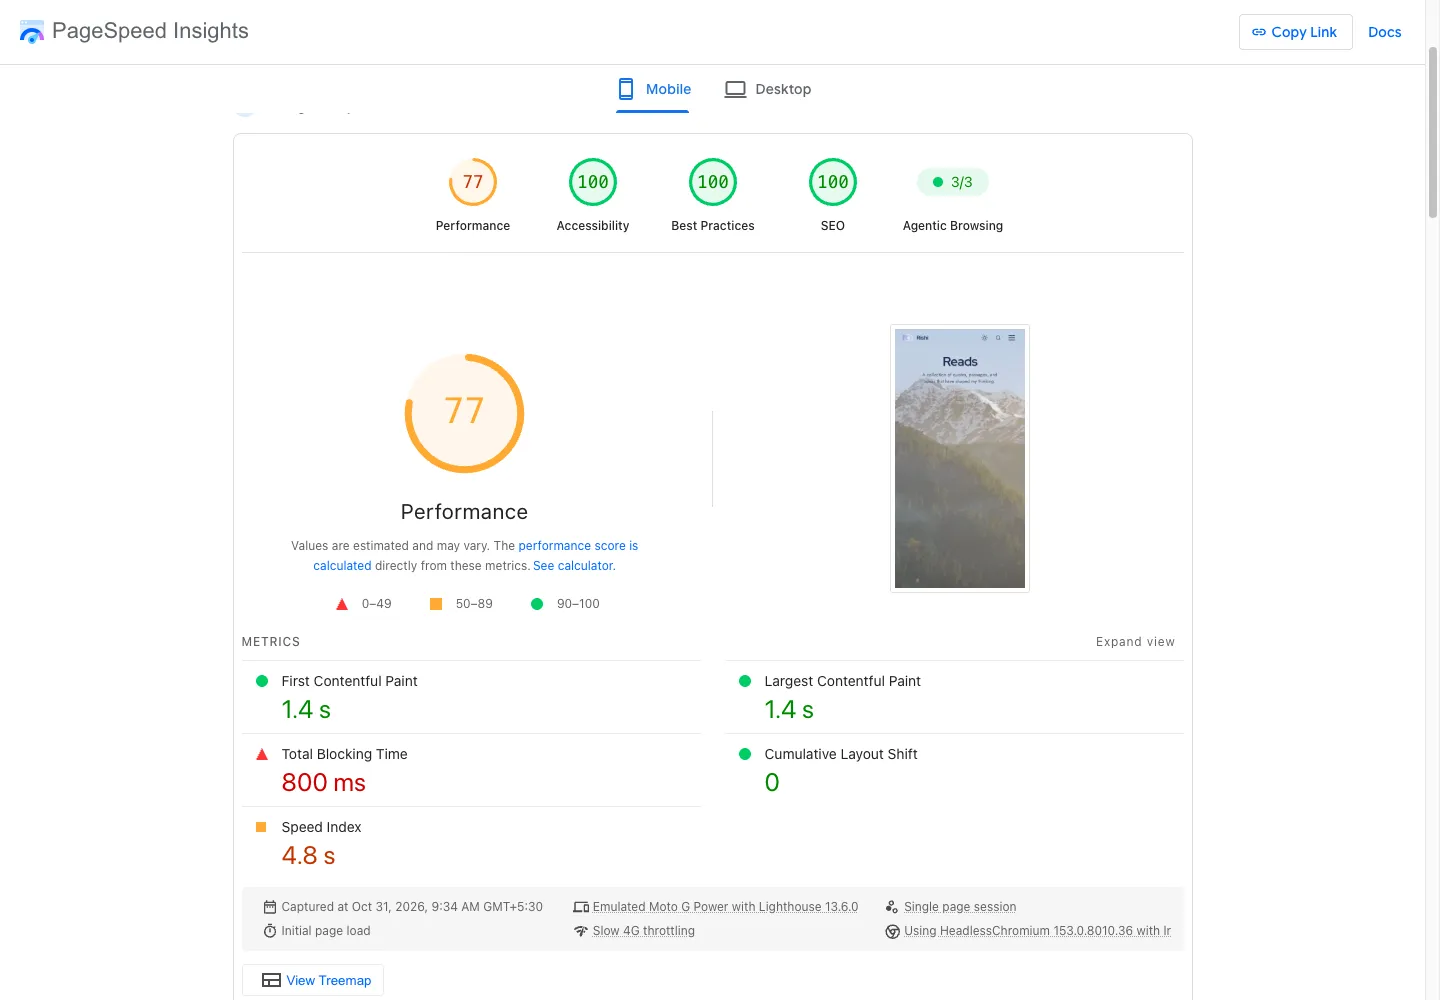 The next report(opens in new tab): 77. The 32,060ms became 800ms.
A score of 77 was a big improvement, but there were still some red numbers: TBT at 800ms and Speed Index at 4.8s. First and Largest Contentful Paint also went up from 0.9s to 1.4s. I haven’t figured out why, but since they’re green, I left it alone.
Fix two: the card painting I’d forgotten about
So the next question was: where did the last 800ms come from?
On the harness, the version I’d just deployed still showed anywhere from 155 to 1240ms of long tasks, and almost all of it was card painting. The worker rendered the scene, but the page still drew every card face to a 2D canvas and handed over bitmaps one per frame. I moved the WebGL, but left the canvas work behind.
PageSpeed blamed those tasks on a gsap file. I think gsap’s requestAnimationFrame callback runs first in the same frame as my paint callback, so it gets the credit.
importantI never confirmed this, but it’s a good reminder: a file name in a long-task list shows who was running at that moment, not who made the task long.
So the painting moved into the worker too. The 2D canvas API works on an OffscreenCanvas, so drawing was the easy part. Fonts were the catch.
A worker doesn’t see the page’s @font-face rules. It has its own font set, and my cards were about to be drawn in Georgia. The fix has three parts:
- The page reads the faces it needs from its own stylesheets (Astro writes them under hashed family names, so I read the stacks from the CSS variables).
- It downloads each file once and transfers the bytes to the worker.
- The worker registers them with
FontFace. MDN listsWorkerGlobalScope.fontsas widely available since September 2022.
loads = fonts.faces.map(function (f) { var face = new FontFace(f.family, f.data, { weight: f.weight, style: f.style }); self.fonts.add(face); return face.load();});With the harness, long-task time dropped from as much as 1,240ms to just 10 to 15ms. The main thread had nothing left to paint.
Fix three: the loader that wouldn’t composite
There was one more finding in the report: a non-composited animation. This was my loading screen, which faded out using a visibility transition. Since changing visibility can’t run on the compositor, I switched the loader to fade out with opacity only and remove itself after the transitionend event. It was a small change, but it removed a warning.
Back to 100!
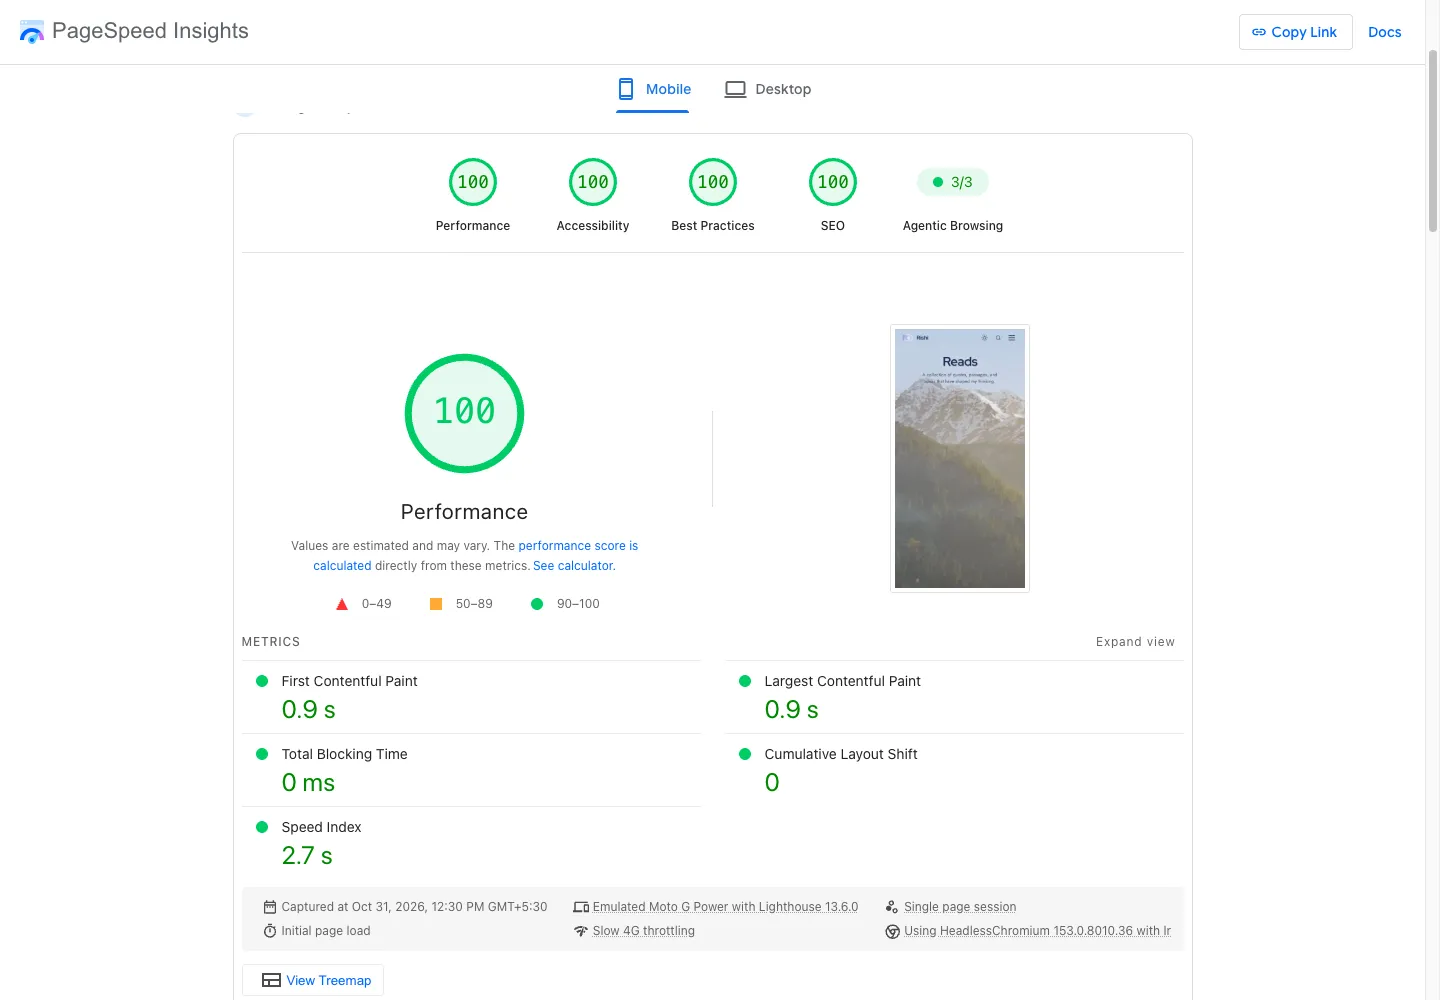 The final report(opens in new tab): 100, with 0ms of blocking time.
TBT dropped to 0 ms! Speed Index improved from 4.8s to 2.7s, and FCP and LCP returned to 0.9s.
noteThe report still has “Use efficient cache lifetimes” (254 KiB). GitHub Pages serves everything with
cache-control: max-age=600and the repo can’t change that. It costs nothing at 100, but it’s still there.
Although, these are lab numbers. If you’re not familiar with the lab-versus-field gap, my Core Web Vitals guide covers it. I also haven’t tested the worker path on Safari or Firefox, including font loading in a worker and the main-thread fallback. But I tried it on my phone, and the swipe feels good enough.
And honestly, who’s reading my rants on this website anyway?
Takeaways
I had also tried a few other things. “First theory is not always the right one.” Or something like that.
- Draco or meshopt compression. The scene uses a single shared mesh with 7,188 vertices and builds in 3.7ms, so there’s really nothing to compress.
- Cards as pre-rendered images. I exported the card art to 17 WebP files, totaling 427 KB, which takes about 2 seconds to download on slow 4G. Compositing them locally took 2.6 to 2.8 seconds, compared to 1.7 to 2.0 seconds for painting in the worker. So this approach didn’t work out.
- I considered Partytown, but its documentation says DOM operations from the worker are throttled and blocking. Since a three.js scene makes thousands of GL calls per frame, I decided not to test WebGL with it.
bonusThe worker bundle is about 600 KB raw and about 150 KB gzipped, mostly because of three.js. This is the main reason the Speed Index isn’t lower.
A green LCP doesn’t guarantee the page is usable. Check which thread is handling the work before you start optimizing. Also, test on a slower machine than yours, since that’s what determines the score. Or, if you’re like me, build a harness to simulate it. It doesn’t take much time, especially now that we all have Copilot, Claude, or whatever your favorite AI subscription is.
So yes, I rebuilt a page to float, but then had to make sure it didn’t freeze.
Happy rendering.. off the main thread!


