Core Web Vitals: Real-World Optimization Strategies
Complete Guide to LCP, INP, and CLS Optimization for Better Rankings
note2026 Edition Available: For the latest Core Web Vitals changes and 2026-specific strategies, see my two-part series: Understanding LCP, INP & CLS and Optimization Strategies & Quick Wins.
Google’s Core Web Vitals are a set of user-centric metrics that measure page load speed, interactivity, and visual stability. These metrics (Largest Contentful Paint, Interaction to Next Paint, and Cumulative Layout Shift) directly impact both user experience and search rankings.
In this article, we’ll go through each Core Web Vitals metric in plain language, explain what factors affect them, and provide practical tips and code examples to optimize them for SEO and UX.
bonusGoogle advises that achieving “good Core Web Vitals” aligns with what its ranking systems “seek to reward”.
Core Web Vitals Metrics Overview
noteIn 2024, Google replaced the old First Input Delay (
FID) metric with the new Interaction to Next Paint (INP) metric to better capture real-world responsiveness. In this article, I’m going to use the same.
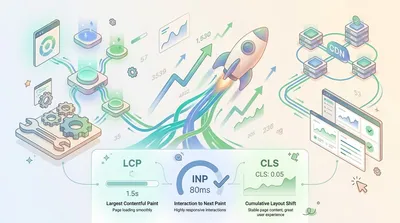
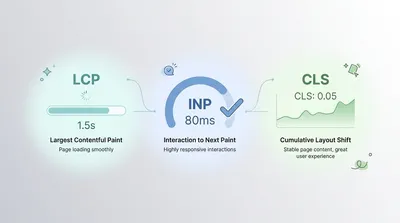
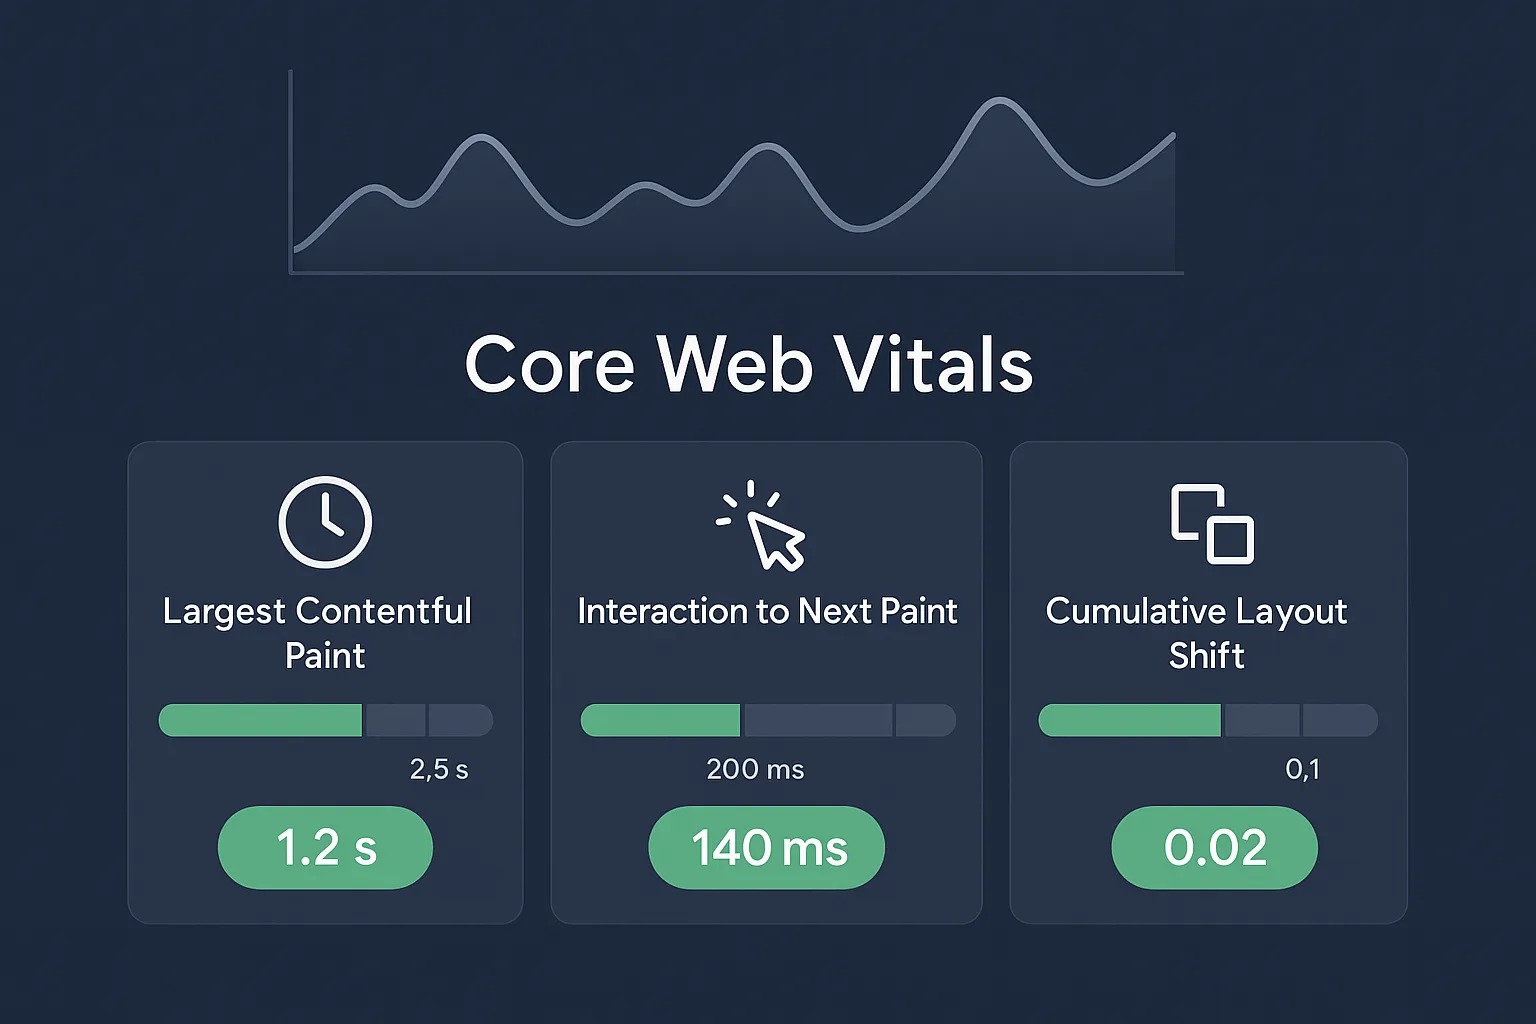
Largest Contentful Paint (LCP) measures load performance. In simple terms, it marks the time when the largest piece of content (image, video, or block of text) becomes visible to the user. A fast LCP reassures users that the page is useful. A good LCP score is 2.5 seconds or less (75th percentile of page loads), while an LCP over 4 seconds is considered poor.
Interaction to Next Paint (INP) measures page responsiveness. It replaces FID as of March 2024. INP looks at all click, tap, and keypress interactions during a user’s visit and reports a value close to the slowest one (excluding rare outliers). A low INP means the page consistently responds quickly. Google recommends an INP ≤ 200 ms (75th percentile), 200–500 ms needs improvement, and over 500 ms is poor.
Cumulative Layout Shift (CLS) measures visual stability. It sums up all unexpected layout shifts that occur while the page is loading and interacting. A shift happens when visible elements move from one frame to the next (e.g. an image or ad loading pushes content down). Unanticipated shifts can frustrate users or cause mis-clicks. A good CLS score is 0.1 or less (75th percentile); anything above 0.25 is considered poor.
importantEach metric is evaluated on the 75th percentile of user experiences, so one slow pageview out of many can push our score into the “needs improvement” or “poor” range. In summary, we must strive for LCP ≤ 2.5 s, INP ≤ 200 ms, and CLS ≤ 0.1 to provide a smooth user experience and help SEO.
Measuring and Monitoring Core Web Vitals
Before optimizing, we need to measure these metrics for our site. Google provides several tools that share the same underlying data (Chrome User Experience Report).
For quick feedback, use Chrome DevTools – its Performance panel can show live LCP, INP, and CLS data for your page, even overlaying real-user (CrUX) values on your local load test.
PageSpeed Insights (PSI) reports lab metrics and field data (CrUX) for a URL or origin, including LCP, INP, and CLS.
If your site has a Search Console property, check the Core Web Vitals report there for a breakdown of URL performance over the past 28 days. Search Console is especially useful for tracking metrics over time on real traffic.
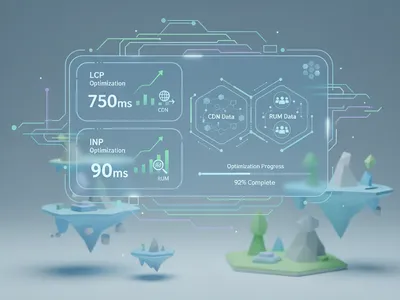
For deeper analysis or custom dashboards, use CrUX tools: the CrUX Dashboard and CrUX Vis (based on Google Data Studio) let you slice Web Vitals data by device, origin/page, and more. However, CrUX data has a delay (typically a few weeks of aggregate data) and may not cover very low-traffic pages.
Real User Monitoring (RUM) for immediate and detailed data, instrument your own RUM. The easiest way is using the
web-vitalsJavaScript library, which reports LCP, INP, CLS (and other vitals) using the browser’s Performance APIs. You can send these values to your analytics or a logging endpoint.
Many third-party RUM services (e.g. New Relic, Datadog, SpeedCurve) also now have built-in Core Web Vitals support. Field data from RUM captures your specific users’ experiences and can pinpoint which pages or interactions need attention.
tipAlways compare lab measurements to field data. A development/test environment may load faster (e.g. cached assets, faster CPU), yielding optimistic metrics. Use field data (CrUX or RUM) as the source of truth for what real users see. When using lab tools, consider throttling CPU/network in DevTools to mimic slower devices and networks.
Optimizing Largest Contentful Paint (LCP)
LCP is heavily influenced by how quickly the largest content on the page can be downloaded and rendered. To improve LCP, examine the entire loading process.
Two critical factors are:
- Initial server response (TTFB)
- Speed of loading the LCP resource (often a large image, video, or a block of text that requires web fonts).
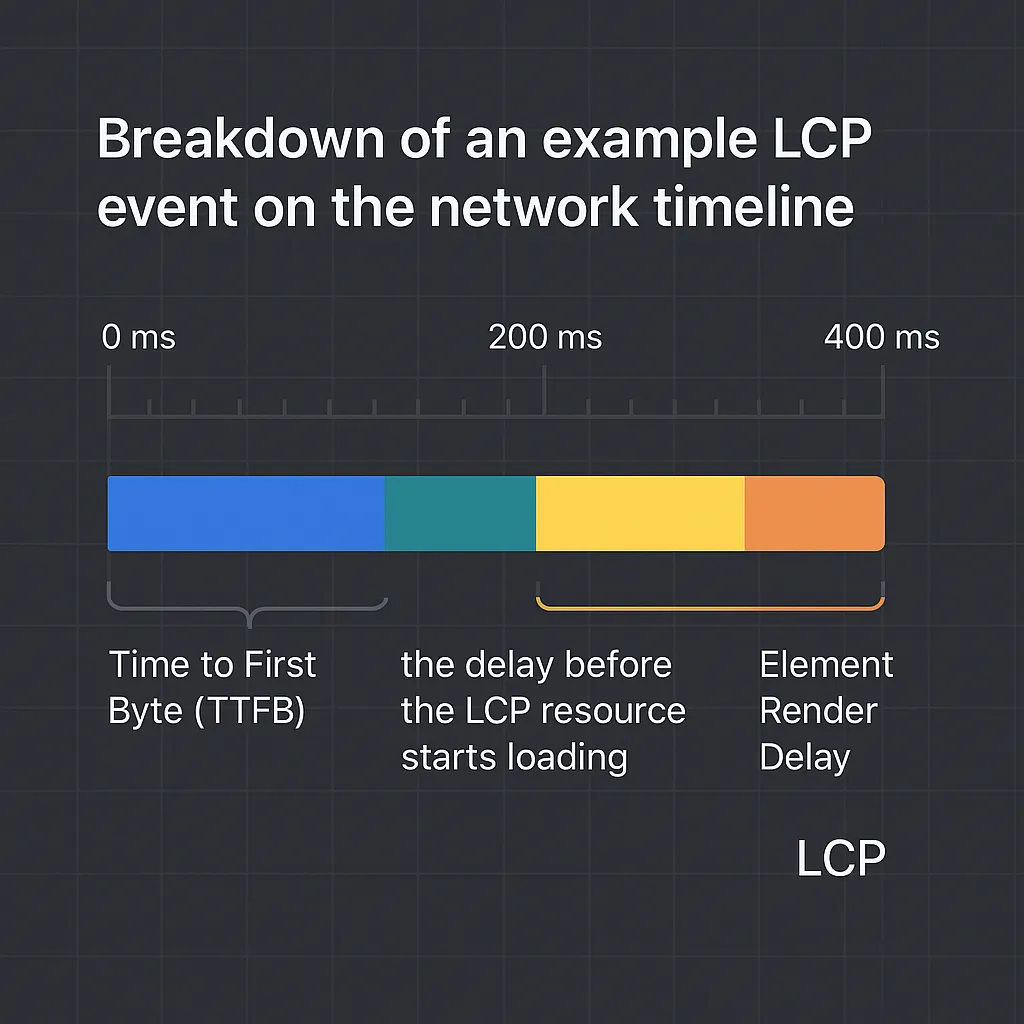
The Time to First Byte (TTFB), the delay before the LCP resource starts loading, its Resource Load Duration, and the Element Render Delay all add up to LCP. Optimizing each can improve your LCP score.
So what can be done?
Reduce server response time. A slow TTFB (time from navigation to first byte) delays LCP. Use a fast backend or CDN. Enable gzip/Brotli compression and caching on your HTML documents. For dynamic sites, optimize database queries or use edge caching (e.g. Cloudflare Pages, AWS CloudFront).
Optimize the LCP resource. Identify which element is triggering LCP (Chrome DevTools Performance tab or Lighthouse can highlight the “Largest Contentful Paint” element). If it’s an image or video, compress it (modern formats like WebP or AVIF can cut size dramatically) and serve scaled versions for each device. Lazy-load images or videos that are not in the initial viewport so they don’t compete for bandwidth. For the main (above-the-fold) image or video, consider preloading it.
For example:
<!-- Preload a hero image so the browser knows to fetch it early -->
<link rel="preload" as="image" href="/images/hero-large.jpg">
<img src="/images/hero-large.jpg" alt="Hero" width="1200" height="800">
Preloading tells the browser to fetch the resource with high priority. Always pair a preload with the exact image URL and the same width/height (or CSS aspect-ratio) to avoid layout shifts (see CLS tips below).
tipFor even more control over resource loading priority, check out Part 3 which covers the Fetch Priority API (
fetchpriorityattribute), advanced resource hints like<link rel="preconnect">, and Real User Monitoring strategies to measure the impact of your optimizations.
Minimize render-blocking resources. CSS and JavaScript that block rendering can delay LCP. Critical CSS needed to render above-the-fold content should be inlined or loaded with high priority. Use
rel="preload"on your main stylesheet, or split CSS so that only essential styles load first. For non-critical JS, usedeferorasync.<!-- Defer non-essential scripts --> <script src="/js/analytics.js" defer></script> <script src="/js/app-analytics.js" async></script>Deferring scripts ensures they don’t block initial rendering.
Use efficient CSS and fonts. Complex CSS calculations or large CSS files can slow down rendering. Keep above-the-fold CSS lean. For web fonts, use
font-display: swaporoptionalso text renders immediately with a fallback font, then swaps to the custom font, avoiding a delay in text rendering that could slow LCP. You can also preload key web fonts:<link rel="preload" href="/fonts/myfont.woff2" as="font" type="font/woff2" crossorigin> <style> @font-face { font-family: 'MyFont'; src: url('/fonts/myfont.woff2') format('woff2'); font-display: swap; } </style>This ensures text appears quickly (improving LCP if the largest content is text) and doesn’t block the render.
Split Long Tasks. If the page’s main thread is busy running JavaScript tasks during load, it can delay rendering. Use code splitting and Web Workers for heavy scripts. For example, use
requestIdleCallback()orsetTimeoutto break large computations into chunks:// Break a large task into smaller chunks to keep the main thread responsive function doWork(items) { if (!items.length) return; const item = items.shift(); process(item); // Schedule the next chunk setTimeout(() => doWork(items), 0); } doWork(largeItemList);This way, the browser has a chance to render and respond between chunks.
tipRegularly test LCP improvements by using Chrome DevTools (Performance panel live LCP metric) or WebPageTest (which shows the waterfall and the LCP element) to see if changes are effective. The goal is to make the critical content start rendering as soon as possible after navigation.
Optimizing Interaction to Next Paint (INP)
INP reflects how quickly your page responds to user input. A “good” INP means interactions feel snappy. To improve INP, focus on avoiding long tasks and ensuring quick feedback after any click, tap, or keypress:
Break Up Long Tasks. If your page has large JavaScript tasks (e.g. complex initialization, data processing, or animation code), they can delay input handling. Identify long tasks using Chrome DevTools’ Performance panel: look for “Long Task” warnings. Refactor these tasks by splitting them into smaller asynchronous chunks or moving work to Web Workers. For example:
// Example: use a Web Worker for expensive calculation
// main.js
const worker = new Worker('worker.js');
worker.postMessage(largeData);
worker.onmessage = (e) => {
  console.log('Result:', e.data);
};
// worker.js
self.onmessage = (e) => {
  const result = heavyComputation(e.data);
  self.postMessage(result);
};
Web Workers run off the main thread, so input events can be handled promptly.
Optimize Event Handlers. Keep click/tap handlers fast. If a handler must do heavy work, consider
requestAnimationFrameorrequestIdleCallbackto defer non-essential work until after the immediate UI updates. Always prevent default only if necessary.Use
asyncanddeferfor scripts. As in LCP, loading heavy JS files asynchronously avoids blocking input readiness. Modern frameworks like React/Vue/Angular often allow lazy-loading components so the initial bundle is smaller.Prevent Input Delay After Navigation. Traditionally, FID measured delay only for the first interaction. INP considers all interactions. That means even after page load, avoid running unnecessary JS that ties up the main thread. For example, if you have background tasks (analytics, polling, etc.), defer them or throttle their work so they don’t conflict with user interactions.
Monitoring INP often requires field data. Use RUM (web-vitals) to capture INP values for user sessions. For lab testing, you can simulate interactions in Chrome DevTools (Performance > Experience helps show INP for recorded interactions).
tipAim to keep the 75th-percentile INP under 200 ms so that almost all users experience responsive input.
Optimizing Cumulative Layout Shift (CLS)
CLS measures how much content moves unexpectedly. To achieve a low CLS, ensure that every element has a defined size or reserve space before it appears:
Always include dimensions. For
<img>and<video>tags, specifywidthandheightattributes (or use CSS withaspect-ratio). This reserves space in the layout so the browser can allocate the correct area before the resource loads. Example:<!-- Image with explicit dimensions --> <img src="photo.jpg" alt="Photo" width="800" height="600"> <!-- OR using CSS aspect-ratio --> <style> .hero-image { width: 100%; aspect-ratio: 4/3; } </style> <img class="hero-image" src="photo.jpg" alt="Hero Image">In both cases, the browser knows the image’s layout size in advance, preventing shift when it loads.
Reserve ad and widget space. Third-party ads, embeds, or iframes often inject content dynamically. Allocate fixed containers for them with CSS (e.g.,
min-heightor explicitwidth/height) so they don’t push other content when they appear. For example:<div class="ad-slot" style="width:300px; height:250px;"> <!-- Ad code here --> </div>Handle web fonts carefully. Sometimes a custom font loads after initial text render, causing reflow. Use
font-display: optionalorswap(as shown above) to avoid invisible text or large shifts when fonts load. Preloading key fonts also helps.Be cautious with dynamic content. Content injected late (e.g. pop-ups, banners, images in carousel slides) can cause shifts. If you insert content, try to do so below the fold or after allocating space. For example, if showing a notification banner, set
position: fixed; top: 0; height: 50px;and addpadding-top:50px;to the body content beforehand, so the layout doesn’t jump when it appears.Use CSS transform for animations. When animating elements (carousels, menus), prefer
transformandopacityrather than changing layout properties likeheightortop. This way, animations are smoother and don’t count as layout shifts.
The key is to eliminate unexpected movements. As web.dev notes, common causes of a bad CLS score include images or ads without size attributes and dynamic content loading. By planning your layout and loading strategy, you can keep CLS low (ideal ≤0.1) and avoid jarring user experiences.
Tools and Workflow Recommendations
- Lighthouse & Chrome DevTools: Use Lighthouse (in Chrome DevTools or via CLI) for a quick audit. Its Performance report will flag Core Web Vitals issues and suggest fixes. The new Web Vitals section in DevTools’ Performance panel highlights LCP, INP, and CLS timings on your recording. For automated testing in your CI/CD pipeline, see my guide on Automated Performance Testing with Lighthouse CI & GitHub Actions.
- WebPageTest: For detailed waterfalls and screenshots. It can measure CLS visually and break down LCP time.
- Google Search Console: Monitor your Core Web Vitals report over time. It shows the percentage of URLs passing each metric on desktop and mobile.
- PageSpeed Insights: Good for quick checks; shows real-user LCP/INP/CLS if available, and provides Lighthouse diagnostics. Remember to check both Mobile and Desktop tabs.
- CrUX Dashboard/Studio: If you need custom dashboards or deep analysis (e.g. by country, device), use the Chrome UX Report data in BigQuery or Google Data Studio.
- Web Vitals RUM Library: Install Google’s
web-vitalsJS library to automatically collect LCP, INP, and CLS in your own analytics. It uses the browser’s Performance Observer APIs and is easy to integrate with Google Analytics or any data pipeline.
Keeping an eye on Core Web Vitals should be an ongoing process. You can also checks into your development workflow depending on your priority.
For instance, use performance budgets in CI tools or have Lighthouse fail a build if LCP exceeds 2.5s. Use RUM alerts to catch regressions (e.g. if average LCP suddenly spikes).
Summary
- Monitor Continuously: Use Chrome DevTools, PageSpeed Insights, and Search Console to track LCP, INP, and CLS for your pages. Supplement with RUM (web-vitals library or analytics) for real-user data.
- Prioritize Content: Ensure the largest above-the-fold elements load first. Preload or inline critical assets (fonts, hero images, CSS) to improve LCP. Compress and use modern formats.
- Manage JavaScript: Keep the main thread free during load. Defer/async scripts, break long tasks, and consider code splitting or Web Workers for heavy work to keep INP low.
- Reserve Space: Always set size attributes or CSS aspect-ratio for images, videos, iframes, and ad slots. Avoid inserting content above existing content without accounting space to minimize CLS.
- Test on Real Devices: Real users often have slower CPUs or connections. Simulate mobile and throttled networks in DevTools. Use CrUX/field data to guide optimizations.
- Achieve the Targets: Aim for LCP ≤ 2.5 s, INP ≤ 200 ms, CLS ≤ 0.1 (75th percentile). These are “good” thresholds for user experience and SEO benefit.
Improving Core Web Vitals is a continuous effort, but focusing on these metrics will make your site feel snappier and more stable for users—and help your search rankings too.
Happy hacking!