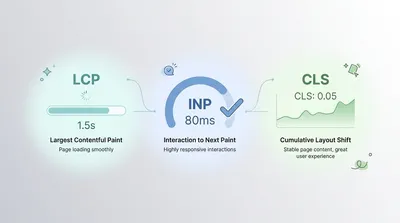
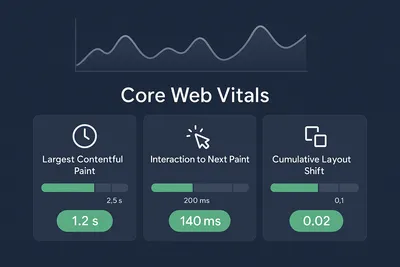
Advanced Core Web Vitals: LCP, INP, CDN & Real User Monitoring
Master Resource Hints, Task Scheduling, and Field Data Collection for Peak Performance

noteSee Also: Core Web Vitals in 2026 for the latest updates and a beginner-friendly overview, and Optimization Strategies & Quick Wins for actionable 2026 techniques.
In the first part of this series, we covered the fundamentals of Core Web Vitals optimization. Part 2 focused on image optimization strategies.
Now, I’m going to cover some of the advanced techniques that take us from “needs improvement” to that satisfying green checkmark: resource prioritization, task scheduling, CDN strategies, and real user monitoring.
Over the years, I’ve watched folks obsess over their Lighthouse scores, only to discover that real users experience something completely different.
Hell, I’ve been one of them at some point.
That 95 score you’re proud of? Your users on 3G networks are seeing something closer to 40.
These techniques are about bridging that gap between lab perfection and messy reality.
note
Advanced LCP Optimization with Resource Hints
Understanding the Fetch Priority API
Browsers are smart about prioritization, but they can’t read your mind. I’ve seen this play out countless times and probably you have too. A beautiful hero section delayed by 2 seconds because the browser decided to download five different JavaScript bundles first.
The browser’s just following its default priority queue. It doesn’t know that the hero image is more important than that analytics script loading in the footer.We need to help it make better decisions.
The Fetch Priority API (fetchpriority attribute) gives you fine-grained control over resource loading priority.
The fetchpriority attribute accepts three values:
high: Boost priority relative to other resources of the same typelow: Reduce priority relative to other resources of the same typeauto(default): Let the browser decide
important
fetchpriorityis a hint, not a directive. The browser will try to respect your preference but may override it based on other factors like network conditions or resource contention.Think of it as a strong suggestion rather than a command.
Boosting LCP Image Priority
Once you’ve identified your LCP element (Chrome DevTools or PageSpeed Insights can tell you), you can dramatically improve load time by setting it to high priority:
<!-- LCP image with high priority -->
<img
  src="/hero-image.webp"
  alt="Product showcase"
  fetchpriority="high"
  width="1200"
  height="600"
>
This tells the browser: “Hey, start downloading this image immediately — don’t wait.” It’ll load at the same priority level as critical CSS and JavaScript, rather than queuing up behind them.
And that also brings me to another thing I learned along the way — this doesn’t magically make images load faster if your server is slow or the image is massive. It just changes the download order. You still need to optimize the image itself (see part 2 of this series).
tipFor LCP background images loaded via CSS, use a
<link rel="preload">withfetchpriority="high":<link rel="preload" as="image" href="/hero-bg.webp" fetchpriority="high" >
Deprioritizing Non-Critical Images
Just as important as boosting critical resources is reducing priority for non-critical ones. This is where you can really help the browser make smart choices.
For example, images in a carousel that aren’t initially visible:
<ul class="carousel">
  <!-- First slide: high priority (LCP candidate) -->
  <img src="/slide-1.jpg" fetchpriority="high" alt="Featured product">

  <!-- Hidden slides: low priority -->
  <img src="/slide-2.jpg" fetchpriority="low" alt="Product 2">
  <img src="/slide-3.jpg" fetchpriority="low" alt="Product 3">
  <img src="/slide-4.jpg" fetchpriority="low" alt="Product 4">
</ul>
Think of your bandwidth budget like a checkout line at a store. If you let everyone through at once, it’s chaos. But if you prioritize who goes first, things move smoothly.
importantDon’t use
loading="lazy"on your LCP image. I see this mistake all the time—developers applying lazy loading to everything, including the hero image. I’ve definitely done this early in my career.It delays loading until the browser confirms the image is in the viewport, which defeats the entire purpose of making it load fast. Use
fetchpriority="high"instead.
Preconnect to Critical Origins
When your LCP resource lives on a different origin — like a CDN or image service — the browser needs to establish a connection before it can download anything. This involves DNS lookup, TCP handshake, and TLS negotiation. On mobile networks, that’s easily 100-300ms (depending on the network) of pure waiting.
I remember a case where the LCP image itself downloaded in 200ms, but the connection setup took 400ms. The image was optimized perfectly, but the network handshake was the real bottleneck.
tipOnly preconnect to 2-3 critical origins. Each preconnect consumes resources—CPU, memory, and socket connections. Too many can actually slow down your page by competing for bandwidth during the critical initial load phase.
More isn’t always better.
Use <link rel="preconnect"> to start these connections as early as possible:
<head>
  <!-- Preconnect to CDN hosting LCP image -->
  <link rel="preconnect" href="https://cdn.example.com">

  <!-- Preconnect to font provider -->
  <link rel="preconnect" href="https://fonts.googleapis.com">
  <link rel="preconnect" href="https://fonts.gstatic.com" crossorigin>
</head>bonusUsing
fetchpriority="high"on the LCP image can improve LCP by 0.7 seconds on slow connections, according to a Google Flights experiment documented on web.dev. See: https://web.dev/articles/fetch-priority (includes WebPageTest filmstrip comparison).That’s the difference between a green score and a red one.
Advanced INP Optimization with Task Scheduling
Imagine a user frantically clicking your button five times because your JavaScript is too busy to respond.
The clicks are queuing up, waiting for the main thread to free up.
The user thinks your site is broken. Your code is just… busy.
Interaction to Next Paint (INP) measures how quickly your page responds to user interactions. Poor INP almost always stems from the same culprit: long tasks blocking the main thread.
Let’s talk about how to fix that.
Understanding Long Tasks
Any JavaScript execution that runs for more than 50 milliseconds is considered a long task. During that time, the browser cannot respond to user input—clicks, taps, keystrokes all get queued up, waiting.
Let’s try to understand this with an example. Say we have some initial processing to do:
// Blocks the main thread for a long time
function processAllData(items) {
  for (const item of items) {
    // Complex processing for each item
    calculateMetrics(item);
    updateState(item);
    validateData(item);
  }
}
If items has 1,000 entries and each takes 1ms to process, you’ve got a 1-second long task. During that entire second, your UI is frozen. The user can’t scroll, can’t click, can’t do anything.
The solution is to break long tasks into smaller chunks, yielding control back to the browser between chunks. Think of it like taking breaks during a marathon instead of trying to sprint the whole thing.
Using scheduler.yield() for Yielding
The modern, recommended approach is scheduler.yield() (available in Chrome 94+). Unlike older techniques like setTimeout, it maintains execution priority so your code resumes before other lower-priority tasks:
// Good: Yields to allow browser to handle interactions
async function processAllData(items) {
  for (const item of items) {
    // Process the item
    calculateMetrics(item);
    updateState(item);
    validateData(item);

    // Yield to the main thread
    await scheduler.yield();
  }
}
Here’s what makes scheduler.yield() better than the old setTimeout(fn, 0) trick: it remembers what you were doing and gives you priority to continue. With setTimeout, your code goes to the back of the queue behind everything else.
important
scheduler.yield()is not yet supported in all browsers (notably Safari as of October 2025).Always include a fallback for cross-browser compatibility. We’ll cover that next.
Cross-Browser Yielding Pattern
Here’s a yielding function to make it work across all browsers:
function yieldToMain() {
  // Use scheduler.yield() if available (Chrome 94+)
  if (globalThis.scheduler?.yield) {
    return scheduler.yield();
  }

  // Fallback to setTimeout for other browsers
  return new Promise(resolve => {
    setTimeout(resolve, 0);
  });
}

// Usage
async function processLargeDataset(data) {
  for (const item of data) {
    processItem(item);

    // Yield to keep UI responsive
    await yieldToMain();
  }
}
The setTimeout fallback works everywhere and provides similar benefits—you just lose the priority preservation. In practice, the difference is minimal for most use cases.
tipDon’t stress about browser support for
scheduler.yield(). ThesetTimeoutfallback is solid and has been the standard approach for years. You’re not leaving anyone behind.
Batching Work to Reduce Overhead
Yielding after every single operation introduces overhead. Each yield is a round trip through the browser’s task queue. For small operations, that overhead can actually make things slower.
A smarter approach is to batch work and only yield when you’ve been running for a certain amount of time:
async function processWithDeadline(items, deadline = 50) {
  let lastYield = performance.now();

  for (const item of items) {
    // Process the item
    processItem(item);

    // Only yield if we've exceeded the deadline
    const now = performance.now();
    if (now - lastYield > deadline) {
      await yieldToMain();
      lastYield = performance.now();
    }
  }
}
This approach processes as many items as possible within the 50ms budget, then yields. It’s the sweet spot between responsiveness and efficiency. You’re not yielding wastefully, and you’re not blocking for too long.
If you have a large data table and yielded after every single row, the overhead of all those yields could actually make the rendering slower than the original blocking version. Batching fixes this.
CDN Strategies for Core Web Vitals
Content Delivery Networks (CDNs) are essential for optimizing Core Web Vitals, particularly LCP. CDNs can turn a 1.5-second TTFB into 80ms just by serving from a nearby edge location. The math is simple:
servers closer to users = faster everything.
A well-configured CDN improves performance in two ways:
- Reducing latency: Geographic proximity cuts down network roundtrip time
- Caching: Cached resources load instantly, eliminating server processing and network time entirely
Essential CDN Configuration
Set aggressive cache durations for versioned static assets. If your filename includes a hash (like app.a3f21b.js), you can cache it forever since the next build will generate a different hash:
// Express.js example
app.use(express.static('public', {
  maxAge: '1y',
  immutable: true
}));
The immutable flag tells the browser: “This file will never change. Don’t even bother checking.” It’s a huge win for returning visitors.
tipUse versioned filenames (e.g.,
app.v123.jsor content hashes) so you can cache aggressively without worrying about stale content. Build tools like Webpack, Vite, and Astro handle this automatically.You deploy new code, the hash changes, users get the new version. Old cache entries just expire naturally.
Optimize Cache-Control headers:
# Versioned static assets (app.a3f21b.js, style.f42e9a.css)
Cache-Control: public, max-age=31536000, immutable

# HTML documents (they reference versioned assets)
Cache-Control: public, max-age=0, must-revalidate
Ensure your CDN supports modern protocols:
- HTTP/2 or HTTP/3: Multiple resources load in parallel over a single connection
- TLS 1.3: Faster connection setup (1 round trip instead of 2)
- Brotli compression: 10-20% smaller files than gzip
Most major CDNs (Cloudflare, Fastly, CloudFront, Vercel) support all of these by default now.
CDN Best Practices
- Use a CDN for all static assets (images, CSS, JS, fonts)
- Configure long cache durations (1 year) for versioned assets
- Enable Brotli compression and HTTP/2+
- Preconnect to your CDN origin from your HTML
- Monitor cache hit ratio (aim for >90%)
- Consider edge computing (Cloudflare Workers, Vercel Edge Functions) for dynamic content optimization
noteIn my experience, one of the most common CDN misconfigurations is query parameters cache-busting every request. If you have great caching but terrible cache hit ratio, check if non-essential query params are being treated as unique URLs.
A small config change to ignore them can dramatically improve your hit ratio and LCP.
Real User Monitoring (RUM) Implementation
Lab data (Lighthouse, WebPageTest) is useful for finding issues, but Real User Monitoring tells you what your actual users experience. And they’re often very different.
Your Lighthouse score might be 95 because you’re testing on a fast connection with a new MacBook. Your users in rural areas on 3G with a 4-year-old Android phone are seeing something completely different.
RUM data shows you that reality.
Why RUM Matters
- Diverse conditions: Real users have varying devices, network speeds, and geographic locations
- Actual content: Lab tests might not include cookie banners, personalized content, or third-party scripts that slow things down
- User behavior: Real interactions — scrolling, clicking, form submissions — can reveal layout shifts and input delays that lab tests miss
importantGoogle uses RUM data (from the Chrome User Experience Report) to determine if your site meets Core Web Vitals thresholds for search rankings. Your lab scores don’t directly impact rankings — only real user experiences do.
You could have a perfect Lighthouse score and still fail in the field.
Implementing RUM with web-vitals Library
The web-vitals library (maintained by Google Chrome team) is a tiny (~2KB brotli’d) library that accurately measures Core Web Vitals. Install it via npm:
npm install web-vitalsBasic implementation:
import {onCLS, onINP, onLCP} from 'web-vitals';

function sendToAnalytics({name, value, id, rating}) {
  const body = JSON.stringify({
    metric: name,      // 'CLS', 'INP', or 'LCP'
    value: value,      // The metric value
    id: id,            // Unique ID for this page visit
    rating: rating     // 'good', 'needs-improvement', or 'poor'
  });

  // Use sendBeacon so data gets sent even if user navigates away
  navigator.sendBeacon('/analytics', body);
}

onCLS(sendToAnalytics);
onINP(sendToAnalytics);
onLCP(sendToAnalytics);
The callback fires multiple times as metrics update.
For example, CLS can change as the user scrolls and encounters new layout shifts. Use the id field to deduplicate values on your backend so you’re storing the final, most accurate measurement.
note
navigator.sendBeacon()is perfect for analytics because it doesn’t block page navigation.Even if the user clicks a link immediately after your metric is collected, the beacon still gets sent. Regular
fetch()calls can be cancelled mid-flight when the page unloads.
Attribution Build for Debugging
The standard web-vitals build tells you what your scores are. The attribution build tells you why they’re bad.
This is where things get really useful.
// Import from 'web-vitals/attribution' instead
import {onCLS, onINP, onLCP} from 'web-vitals/attribution';

function sendToAnalytics({name, value, id, rating, attribution}) {
  const data = {
    metric: name,
    value: value,
    rating: rating,
    id: id
  };

  // Attribution data helps debug issues
  switch (name) {
    case 'LCP':
      data.element = attribution.element;          // LCP element selector
      data.url = attribution.url;                  // LCP resource URL
      data.ttfb = attribution.timeToFirstByte;     // TTFB timing
      data.renderDelay = attribution.elementRenderDelay;
      break;

    case 'INP':
      data.element = attribution.interactionTarget; // Element clicked/tapped
      data.type = attribution.interactionType;      // 'pointer' or 'keyboard'
      data.inputDelay = attribution.inputDelay;
      data.processingTime = attribution.processingDuration;
      data.presentationDelay = attribution.presentationDelay;
      break;

    case 'CLS':
      data.element = attribution.largestShiftTarget;
      data.value = attribution.largestShiftValue;
      break;
  }

  navigator.sendBeacon('/analytics', JSON.stringify(data));
}

onCLS(sendToAnalytics);
onINP(sendToAnalytics);
onLCP(sendToAnalytics);
This attribution data is invaluable for debugging. For example:
- LCP: If
renderDelayis high, you know the image loaded quickly but rendering was blocked — probably by JavaScript execution or layout work - INP: If
inputDelayis high, the main thread was busy when the user clicked. IfprocessingDurationis high, your event handlers are doing too much work - CLS: The
largestShiftTargettells you exactly which element caused the biggest shift — maybe it’s your ad container, or an image without dimensions
I’ve used this data to fix issues that would’ve taken days to track down otherwise. You’re not guessing anymore — you have concrete data pointing to the problem.
tipIn production, only send attribution data for “poor” scores to reduce noise and data volume:
onLCP((metric) => {
  if (metric.rating === 'poor') {
    sendDetailedReport(metric); // Send full attribution
  } else {
    sendBasicReport(metric);    // Just send value
  }
});
Analyzing RUM Data
Once you’re collecting data, look for patterns:
- Segment by device type: Mobile vs. desktop performance is often drastically different. Mobile might have 3x worse scores
- Segment by connection type: 4G vs. 5G vs. WiFi tells you where your network bottlenecks are
- Segment by geography: Users far from your servers will have higher TTFB — this is where CDN configuration matters
- Look at the 75th percentile, not the median — that’s what Google uses for Core Web Vitals thresholds
Don’t just look at averages. The 75th percentile is what matters for Core Web Vitals. If 75% of your users have LCP ≤ 2.5s, you pass. The median (50th percentile) can look great while you’re still failing the threshold.
bonusChrome User Experience Report (CrUX) provides free aggregated RUM data for millions of websites. You don’t even need to implement anything — if your site has enough Chrome traffic, the data is already being collected.
Check your site using PageSpeed Insights or the CrUX dashboard.
Putting It All Together
These techniques work best when combined. Here’s the workflow you can use:
- Start with RUM Data: Implement
web-vitalslibrary with attribution build to identify which pages and metrics need attention - Optimize LCP: Use
fetchpriority="high"on LCP image, preconnect to CDN origins, configure aggressive caching - Optimize INP: Break up long tasks with
scheduler.yield(), batch work smartly, yield strategically in event handlers - Monitor and Iterate: Track improvements in RUM data, set up alerts for regressions, keep iterating
Don’t try to boil the ocean. Pick one page with poor Core Web Vitals scores, apply these techniques, measure the impact with RUM data, then expand to other pages.
tipStart small and measure everything. Pick your worst-performing page (the one with the most traffic and worst scores), fix it, validate the improvement in RUM data, then move to the next one.
Small wins compound.
bonusTo catch performance regressions automatically before they ship, combine RUM with CI/CD automation. See Automated Performance Testing with Lighthouse CI & GitHub Actions for setting up performance budgets and real-time monitoring in your deployment pipeline.
Wrapping it up
Moving beyond the basics of Core Web Vitals optimization requires intelligent resource prioritization, strategic task scheduling, proper CDN configuration, and continuous monitoring with real user data.
Here’s what we covered in this third part of the series:
- Use
fetchpriority="high"on LCP images and preconnect to critical origins to start downloads immediately - Break up long tasks with
scheduler.yield()(orsetTimeoutfallback) to keep INP low and your UI responsive - Configure your CDN with long cache durations, modern protocols (HTTP/2+, Brotli), and monitor cache hit ratios
- Implement RUM with the
web-vitalslibrary to track real user experiences and debug with attribution data
Remember: optimization is ongoing.
Keep monitoring your RUM data, stay informed about new browser APIs and best practices, and continuously iterate. The web platform keeps evolving, and so should your performance strategy.
Happy Building! Cheers!